Long I wanted to test a simple data manipulation tasks and compare the execution time, ease of writing the code and simplicity between T-SQL and R package for data manipulation.
Couple of packages I will mention for data manipulations are plyr, dplyr and data.table and compare the execution time, simplicity and ease of writing with general T-SQL code and RevoScaleR package. For this blog post I will use R package dplyr and T-SQL with possibilites of RevoScaleR computation functions.
My initial query will be. Available in WideWorldImportersDW database. No other alterations have been done to underlying tables (fact.sale or dimension.city).
USE WideWorldImportersDW;
GO

SELECT
        fs.[City Key]
        ,c.City
        ,c.[Sales Territory]
        ,fs.[Customer Key]
        ,fs.[Invoice Date Key]
        ,fs.[Quantity]
        ,fs.[Unit Price]
        ,fs.[Tax Amount]
        ,fs.[Total Including Tax]
        ,fs.Profit
    FROM [Fact].[Sale] AS  fs
        JOIN [Dimension].[City] AS c
        ON c.[City Key] = fs.[City Key];
For the metrics of comparison I will be using simple time statistics (metrics: elapsed time) and every code will be run from SSMS.
-- Example
SET STATISTICS TIME ON
SELECT GETDATE()
SET STATISTICS TIME OFF
SELECT
First simple test is just printing the data.
PRINT ' '
PRINT 'STATISTICS WITH T-SQL'
PRINT ' '

SET STATISTICS TIME ON
SELECT
        fs.[City Key]
        ,c.City
        ,c.[Sales Territory]
        ,fs.[Customer Key]
        ,fs.[Invoice Date Key]
        ,fs.[Quantity]
        ,fs.[Unit Price]
        ,fs.[Tax Amount]
        ,fs.[Total Including Tax]
        ,fs.Profit
    FROM [Fact].[Sale] AS  fs
        JOIN dimension.city AS c
        ON c.[City Key] = fs.[City Key]

SET STATISTICS TIME OFF

PRINT ' '
PRINT 'STATISTICS WITH R'
PRINT ' '

SET STATISTICS TIME ON
DECLARE @TSQL AS NVARCHAR(MAX)
SET @TSQL = N'SELECT
        fs.[City Key]
        ,c.City
        ,c.[Sales Territory]
        ,fs.[Customer Key]
        ,fs.[Invoice Date Key]
        ,fs.[Quantity]
        ,fs.[Unit Price]
        ,fs.[Tax Amount]
        ,fs.[Total Including Tax]
        ,fs.Profit
    FROM [Fact].[Sale] AS  fs
        JOIN dimension.city AS c
        ON c.[City Key] = fs.[City Key]'

DECLARE @RScript AS NVARCHAR(MAX)
SET @RScript = N'OutputDataSet <- InputDataSet'

EXEC sys.sp_execute_external_script
           @language = N'R'
          ,@script = @RScript
          ,@input_data_1 = @TSQL

WITH RESULT SETS ((
     [City Key]  INT
    ,[City]  NVARCHAR(200)
    ,[Sales Territory]  NVARCHAR(200)
    ,[Customer Key]  INT
    ,[Invoice Date Key]  DATE
    ,[Quantity]  INT
    ,[Unit Price]  DECIMAL(18,3)
    ,[Tax Amount]  DECIMAL(18,3)
    ,[Total Including Tax]  DECIMAL(18,2)
    ,[Profit]  DECIMAL(18,2)
                 ));
SET STATISTICS TIME OFF
This test is very much simple. Outputting the data. In case to T-SQL it is just a simple SELECT statement and in case of R-TSQL is just passing data to R Engine and returning in a data-frame. The test itself is trivial and “absurd” but very important to get the base-line and time related results.

Running the query couple of times on my client, I have some base comparison. T-SQL outperforms R-TSQL and it is almost two-times faster. I would expect higher difference in terms of time, because it involves a lot of data migration and no computations.
Filtering / WHERE
Now let’s perform a simple WHERE clause or some simple filtering.
PRINT ' '
PRINT 'STATISTICS WITH T-SQL'
PRINT ' '

-- SIMPLE T-SQL
SET STATISTICS TIME ON
SELECT
        fs.[City Key]
        ,c.City
        ,c.[Sales Territory]
        ,fs.[Customer Key]
        ,fs.[Invoice Date Key]
        ,fs.[Quantity]
        ,fs.[Unit Price]
        ,fs.[Tax Amount]
        ,fs.[Total Including Tax]
        ,fs.Profit
    FROM [Fact].[Sale] AS  fs
        JOIN dimension.city AS c
        ON c.[City Key] = fs.[City Key]
    WHERE
        [Sales Territory] <> 'Southeast'
    AND fs.[Customer Key] <> 0
    AND Profit <= 1000
SET STATISTICS TIME OFF


PRINT ' '
PRINT 'STATISTICS WITH R'
PRINT ' '

-- R Package dplyr and T-SQL
SET STATISTICS TIME ON

DECLARE @TSQL AS NVARCHAR(MAX)
SET @TSQL = N'SELECT
        fs.[City Key]
        ,c.City
        ,c.[Sales Territory] AS SalesTerritory
        ,fs.[Customer Key] AS CustomerKey
        ,fs.[Invoice Date Key]
        ,fs.[Quantity]
        ,fs.[Unit Price]
        ,fs.[Tax Amount]
        ,fs.[Total Including Tax]
        ,fs.Profit
    FROM [Fact].[Sale] AS  fs
        JOIN dimension.city AS c
        ON c.[City Key] = fs.[City Key]'

DECLARE @RScript AS NVARCHAR(MAX)
SET @RScript = N'
                library(dplyr)
                OutputDataSet  <- InputDataSet %>%
           filter(SalesTerritory != "Southeast", CustomerKey != 0, Profit <= 1000)'

EXEC sys.sp_execute_external_script
           @language = N'R'
          ,@script = @RScript
          ,@input_data_1 = @TSQL

WITH RESULT SETS ((
     [City Key]  INT
    ,[City]  NVARCHAR(200)
    ,[Sales Territory]  NVARCHAR(200)
    ,[Customer Key]  INT
    ,[Invoice Date Key]  DATETIME
    ,[Quantity]  INT
    ,[Unit Price]  DECIMAL(18,3)
    ,[Tax Amount]  DECIMAL(18,3)
    ,[Total Including Tax]  DECIMAL(18,2)
    ,[Profit]  DECIMAL(18,2)
                 ));

SET STATISTICS TIME OFF

Again results of both executions are the same but difference is getting bigger and bigger. Main reason given is that all the data must be transferred to R engine, before being manipulated and results returned.
Now I can perform a simple comparison with dplyr package and RevoscaleR package. In this manner we will have same ground base for comparison.
PRINT ' '
PRINT 'STATISTICS WITH R dpylr'
PRINT ' '

SET STATISTICS TIME ON

DECLARE @TSQL AS NVARCHAR(MAX)
SET @TSQL = N'SELECT
        fs.[City Key]
        ,c.City
        ,c.[Sales Territory] AS SalesTerritory
        ,fs.[Customer Key] AS CustomerKey
        ,fs.[Invoice Date Key]
        ,fs.[Quantity]
        ,fs.[Unit Price]
        ,fs.[Tax Amount]
        ,fs.[Total Including Tax]
        ,fs.Profit
    FROM [Fact].[Sale] AS  fs
        JOIN dimension.city AS c
        ON c.[City Key] = fs.[City Key]'

DECLARE @RScript AS NVARCHAR(MAX)
SET @RScript = N'
                library(dplyr)
                OutputDataSet  <- InputDataSet %>%
filter(SalesTerritory != "Southeast", CustomerKey != 0, Profit <= 1000)'

EXEC sys.sp_execute_external_script
           @language = N'R'
          ,@script = @RScript
          ,@input_data_1 = @TSQL

WITH RESULT SETS ((
     [City Key]  INT
    ,[City]  NVARCHAR(200)
    ,[Sales Territory]  NVARCHAR(200)
    ,[Customer Key]  INT
    ,[Invoice Date Key]  DATETIME
    ,[Quantity]  INT
    ,[Unit Price]  DECIMAL(18,3)
    ,[Tax Amount]  DECIMAL(18,3)
    ,[Total Including Tax]  DECIMAL(18,2)
    ,[Profit]  DECIMAL(18,2)
                 ));

SET STATISTICS TIME OFF

PRINT ' '
PRINT 'STATISTICS WITH R RevoScaleR'
PRINT ' '

SET STATISTICS TIME ON

DECLARE @TSQL1 AS NVARCHAR(MAX)
SET @TSQL1 = N'SELECT
        fs.[City Key]
        ,c.City
        ,c.[Sales Territory] AS SalesTerritory
        ,fs.[Customer Key] AS CustomerKey
        ,fs.[Invoice Date Key]
        ,fs.[Quantity]
        ,fs.[Unit Price]
        ,fs.[Tax Amount]
        ,fs.[Total Including Tax]
        ,fs.Profit
    FROM [Fact].[Sale] AS  fs
        JOIN dimension.city AS c
        ON c.[City Key] = fs.[City Key]'

DECLARE @RevoRScript AS NVARCHAR(MAX)
SET @RevoRScript = N'
                    library(RevoScaleR)
                    OutputDataSet <- rxXdfToDataFrame(rxDataStep(
inData = InputDataSet, outFile="Cust_data_filter.xdf",
overwrite=TRUE, rowsPerRead = 100000,
rowSelection =SalesTerritory != "Southeast" & CustomerKey != 0 & Profit <= 1000))'

EXEC sys.sp_execute_external_script
           @language = N'R'
          ,@script = @RevoRScript
          ,@input_data_1 = @TSQL1

WITH RESULT SETS ((
     [City Key]  INT
    ,[City]  NVARCHAR(200)
    ,[Sales Territory]  NVARCHAR(200)
    ,[Customer Key]  INT
    ,[Invoice Date Key]  DATETIME
    ,[Quantity]  INT
    ,[Unit Price]  DECIMAL(18,3)
    ,[Tax Amount]  DECIMAL(18,3)
    ,[Total Including Tax]  DECIMAL(18,2)
    ,[Profit]  DECIMAL(18,2)
                 ));

SET STATISTICS TIME OFF
With printed output results.

We can see from the print that dplyr package is in this case slightly ahead of RevoScaleR package, but the difference is 0,3 seconds in favour of dplyr. Going through the code, I am creating *.xdf on the fly and still get almost same time results.
Aggregating Data
Now to test the results for aggregating data for all three scenarios.
PRINT ' '
PRINT 'STATISTICS WITH T-SQL'
PRINT ' '

-- SIMPLE T-SQL
SET STATISTICS TIME ON
SELECT
         c.City
        ,c.[Sales Territory]
        ,SUM(fs.[Total Including Tax]) AS Total_turnover
        ,MAX(fs.[Total Including Tax]) AS Max_turnover
        ,MIN(fs.[Total Including Tax]) AS Min_turnover
        --,(fs.[Total Including Tax]) AS Median_turnover
        ,VAR(fs.[Total Including Tax]) AS Var_turnover
        ,STDEV(fs.[Total Including Tax]) AS stdev_turnover
        ,AVG(fs.[Total Including Tax]/fs.Profit) AS KPI_avg_Turnover2profit

    FROM [Fact].[Sale] AS  fs
        JOIN dimension.city AS c
        ON c.[City Key] = fs.[City Key]
    WHERE
        [Sales Territory] <> 'Southeast'
    AND fs.[Customer Key] <> 0
    AND Profit <= 1000
    GROUP BY
         c.[Sales Territory]
        ,c.City

SET STATISTICS TIME OFF


PRINT ' '
PRINT 'STATISTICS WITH R dpylr'
PRINT ' '

SET STATISTICS TIME ON

-- Difference with T-SQL, I Have to pass all the values needed to filter out and
-- aggregate data
DECLARE @TSQL1 AS NVARCHAR(MAX)
SET @TSQL1 = N'SELECT
                     c.City
                    ,c.[Sales Territory] AS SalesTerritory
                    ,fs.[Customer Key] AS CustomerKey
                    ,fs.[Total Including Tax] AS TotalIncludingTax
                    ,fs.Profit
                FROM [Fact].[Sale] AS  fs
                    JOIN dimension.city AS c
                    ON c.[City Key] = fs.[City Key]'

DECLARE @RdplyrScript AS NVARCHAR(MAX)
SET @RdplyrScript = N'
                library(dplyr)
                OutputDataSet  <- InputDataSet %>%
                                     mutate(Turnover2profit=TotalIncludingTax/Profit) %>%
                                    group_by(City, SalesTerritory)   %>%
                                    filter(SalesTerritory != "Southeast", CustomerKey != 0, Profit <= 1000) %>%
                                      summarise(
                                         Total_turnover = sum(TotalIncludingTax, na.rm=TRUE)
                                         ,Max_turnover = max(TotalIncludingTax, na.rm=TRUE)
                                         ,Min_turnover = min(TotalIncludingTax, na.rm=TRUE)
                                         ,Median_turnover = median(TotalIncludingTax, na.rm=TRUE)
                                         ,Var_turnover = var(TotalIncludingTax, na.rm=TRUE)
                                         ,stdev_turnover = sd(TotalIncludingTax, na.rm=TRUE)
                                         ,KPI_avg_Turnover2profit = mean(Turnover2profit, na.rm=TRUE)
                                      )'

EXEC sys.sp_execute_external_script
           @language = N'R'
          ,@script = @RdplyrScript
          ,@input_data_1 = @TSQL1

WITH RESULT SETS ((
     [City]  NVARCHAR(200)
    ,[Sales Territory]  NVARCHAR(200)
    ,Total_turnover DECIMAL(18,3)
    ,Max_turnover DECIMAL(18,3)
    ,Min_turnover DECIMAL(18,3)
    ,Median_turnover DECIMAL(18,3)
    ,Var_turnover DECIMAL(18,3)
    ,stdev_turnover DECIMAL(18,3)
    ,KPI_avg_Turnover2profit DECIMAL(18,3)
    ));

SET STATISTICS TIME OFF


PRINT ' '
PRINT 'STATISTICS WITH R RevoScaleR'
PRINT ' '

SET STATISTICS TIME ON

DECLARE @TSQL2 AS NVARCHAR(MAX)
SET @TSQL2 = N'SELECT
                     c.City
                    ,c.[Sales Territory] AS SalesTerritory
                    ,fs.[Customer Key] AS CustomerKey
                    ,fs.[Total Including Tax] AS TotalIncludingTax
                    ,fs.Profit
                FROM [Fact].[Sale] AS  fs
                    JOIN dimension.city AS c
                    ON c.[City Key] = fs.[City Key]'

DECLARE @RevoRScript AS NVARCHAR(MAX)
SET @RevoRScript = N'
                    library(RevoScaleR)
                    sales_rx1 <- rxDataStep(inData = InputDataSet,
outFile="Cust_data_rx1.xdf", overwrite=TRUE, rowsPerRead = 100000,
                                  rowSelection =SalesTerritory != "Southeast" &
 CustomerKey != 0 & Profit <= 1000)

                    sales_rx2 <- rxDataStep(sales_rx1, outFile="Cust_data_rx2.xdf",
                        transforms=list(
                            turnover2profit=TotalIncludingTax/Profit
                            ,City = City
                            ,SalesTerritory = SalesTerritory
                            ,TotalIncludingTax = TotalIncludingTax
                            ,Profit = Profit
                        ),
                        overwrite=TRUE, rowsPerRead = 100000)

                        sales_rx4 <- rxSummary(TotalIncludingTax~SalesTerritory:City,
data=sales_rx2,
                                               summaryStats=c("Mean", "StdDev",
 "Min", "Max", "Sum"))

                        sales_rx4_1 <- sales_rx4$categorical[[1]][c("SalesTerritory",
"City", "Sum", "StdDev", "Min", "Max")]

                        sales_rx4P <- rxSummary(turnover2profit~SalesTerritory:City,
 data=sales_rx2,
                                               summaryStats=c("Mean"))

                        sales_rx4_2 <- sales_rx4P$categorical[[1]][c("SalesTerritory",
 "City", "Means")]

                        ## Merge data
                        sales_rx5 <- merge(sales_rx4_1, sales_rx4_2,
by=c("SalesTerritory","City"), all=TRUE)
                        names(sales_rx5)[3] <- "Total_turnover"
                        names(sales_rx5)[4] <- "Max_turnover"
                        names(sales_rx5)[5] <- "Min_turnover"
                        names(sales_rx5)[6] <- "stdev_turnover"
                        names(sales_rx5)[7] <- "KPI_avg_Turnover2profit"

                    OutputDataSet <- sales_rx5''

EXEC sys.sp_execute_external_script
           @language = N'R'
          ,@script = @RevoRScript
          ,@input_data_1 = @TSQL2

WITH RESULT SETS ((
     [City]  NVARCHAR(200)
    ,[Sales Territory]  NVARCHAR(200)
    ,Total_turnover DECIMAL(18,3)
    ,Max_turnover DECIMAL(18,3)
    ,Min_turnover DECIMAL(18,3)
    ,Median_turnover DECIMAL(18,3)
    ,Var_turnover DECIMAL(18,3)
    ,stdev_turnover DECIMAL(18,3)
    ,KPI_avg_Turnover2profit DECIMAL(18,3)
    ));

SET STATISTICS TIME OFF
The results are obvious. T-SQL is in this case faster, which is understood. But comparing dplyr and RevoScaleR, RevoscaleR is faster when doing data manipulation and returning results into SSMS. 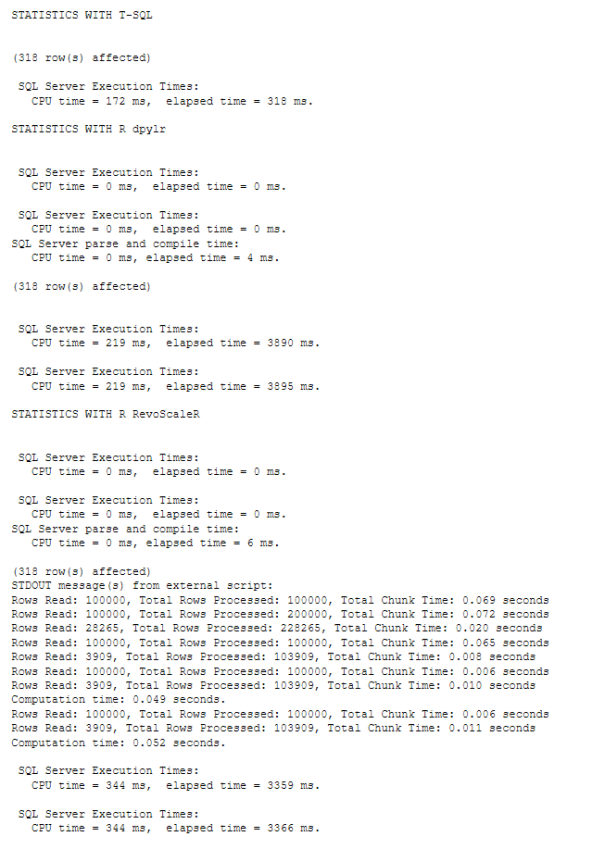
The only problem I have is the amount of code needed to create a simple summary statistics. Even though RevoScaleR is faster as dplyr (and plyr), it is absolutely hard to read and write the code. Chaining / Piping is not possible meaning, that you have to store the intermediate results and storing the xdf files.

RevoScaleR package did the job but consider doing data manipulation in T-SQL or a dedicated data manipulation package, unless you are fine with all the merging, renaming and outputting.
I deliberately added some of the statistics in the output and you can see that median is supported only in dplyr package, where as in T-SQL or RevoScaleR you have to write it and compute it manually. As well I miss Variance metric in RevoScaleR and Mode / Modus in all three – T-SQL, dplyr and RevoScaleR.
In addition, I have also used dplyrXdf which is a dplyr package for *.xdf dataframe and enables user to do chaining / piping with Revoscale external data format. You can install package in RTVS or RStudio using:
devtools::install_github("RevolutionAnalytics/dplyrXdf")
SET STATISTICS TIME ON

-- Difference with T-SQL, I Have to pass all the values needed to filter out
-- and aggregate data
DECLARE @TSQL2 AS NVARCHAR(MAX)
SET @TSQL2 = N'SELECT
                     c.City
                    ,c.[Sales Territory] AS SalesTerritory
                    ,fs.[Customer Key] AS CustomerKey
                    ,fs.[Total Including Tax] AS TotalIncludingTax
                    ,fs.Profit
                FROM [Fact].[Sale] AS  fs
                    JOIN dimension.city AS c
                    ON c.[City Key] = fs.[City Key]'

DECLARE @RevoRScript AS NVARCHAR(MAX)
SET @RevoRScript = N'
                    library(RevoScaleR)
                    library(dplyr)
                    library(dplyrXdf)
                    custXdf <- rxDataFrameToXdf(InputDataSet,
                               outFile="Cust_data_aggregate.xdf", overwrite=TRUE)
                    custagg <- custXdf %>%
                      mutate(Turnover2profit=TotalIncludingTax/Profit) %>%
                      group_by(City, SalesTerritory)   %>%
                      filter(SalesTerritory != "Southeast", CustomerKey != 0,
                                 Profit <= 1000) %>%
                      summarise(
                        Total_turnover = sum(TotalIncludingTax, na.rm=TRUE)
                        ,Max_turnover = max(TotalIncludingTax, na.rm=TRUE)
                        ,Min_turnover = min(TotalIncludingTax, na.rm=TRUE)
                        ,Median_turnover = median(TotalIncludingTax, na.rm=TRUE)
                        ,Var_turnover = var(TotalIncludingTax, na.rm=TRUE)
                        ,stdev_turnover = sd(TotalIncludingTax, na.rm=TRUE)
                        ,KPI_avg_Turnover2profit = mean(Turnover2profit, na.rm=TRUE)
                                )
                OutputDataSet <- data.frame(custagg)'

EXEC sys.sp_execute_external_script
           @language = N'R'
          ,@script = @RevoRScript
          ,@input_data_1 = @TSQL2

WITH RESULT SETS ((
     [City]  NVARCHAR(200)
    ,[Sales Territory]  NVARCHAR(200)
    ,Total_turnover DECIMAL(18,3)
    ,Max_turnover DECIMAL(18,3)
    ,Min_turnover DECIMAL(18,3)
    ,Median_turnover DECIMAL(18,3)
    ,Var_turnover DECIMAL(18,3)
    ,stdev_turnover DECIMAL(18,3)
    ,KPI_avg_Turnover2profit DECIMAL(18,3)
    ));

SET STATISTICS TIME OFF
Problem with dplyrXdf is performance. The code is very very easy to read but execution time is just absurd. I had to run it couple of times and usually get around 1 minute of elapsed time. Which is just beyond my patience zone. I have used different computeContext and it had no effect.
My conclusione: If you can, do all the data manipulation prior to pushing data from T-SQL into R code, because dplyr or data.table do not support parallel computation and no-memory limitations and on the other hand, RevoScaleR functions and capabilities were not meant to do data manipulation at this scale, but are very good for summary statistics and overview.
As always, code is available at GitHub.
Happy R-TSQLing.


[…] Tomaz Kastrun does several performance comparisons between various R packages and T-SQL constructs: […]
LikeLike
[…] article was first published on R – TomazTsql, and kindly contributed to […]
LikeLike
[…] article was first published on R – TomazTsql, and kindly contributed to […]
LikeLike
[…] my previous blog post, I was focusing on data manipulation tasks with RevoScaleR Package in comparison to other data […]
LikeLike