It might happen that you will need a animated graph of any kind. For purposes of plotting demographic data and changes through the years, Google Maps and plotting maps, merging and converting jpg files into a animated gif, sure will give a nice visualization effect.
Here is a sample of changes over the time period of three years on some dataset of my home town and graph can tell little bit more as numbers 🙂
So besides plotting visualizations based on geographical data, additional plots available in any of R packages can be visualized in a similar way.
Playing and goofing around, I created a sample dataset:
# dataset
d <- data.frame(val=c(2,3,4,3,4,3,4,3,2,1),
                year=c(2015,2016,2017,2015,2016,2015,2015,2016,2017,2015)
                )
Once that, is created, a function would do the trick:
setwd("C:/DataTK")
library(ggplot2)
library(dplyr)

plot.bar.2 <- function(df_plot, xvar, yvar, fill)
{
  require(ggplot2)
  require(dplyr)
  attach(df_plot)
  #number of steps - based on values in X-axis
  x_unique <- unique(df_plot$xvar)   #xvar = year
  nof_steps <- as.integer(length(df_plot$x_unique))

  for (i in 1:nof_steps)
  {
    x <- as.integer(x_unique[i])

    d1 <- df_plot %>%
          arrange(xvar) %>%
          filter(xvar<=x) %>%
          mutate(new_val = val) %>%
          select(xvar, new_val)

    d2 <- df_plot %>%
          arrange(xvar) %>%
          filter(xvar>x) %>%
          mutate(new_val = 0) %>%
          select(xvar,new_val)

    dfinal <- union_all(d1, d2)
    dfinal <- data.frame(dfinal)
    colnames(dfinal)[1] <- "x"
    colnames(dfinal)[2] <- "y"

    name <- paste('barplot00',i,'.png',sep="")
    png(name)
    ggplot(data=dfinal, aes(x=x, y=y, fill=x)) + geom_bar(stat="identity") +
        guides(fill=FALSE)
    dev.off()
    rm(d1,d2,x,dfinal)
  }

  system("magick -delay 150 -loop 0 *.png GeomBar_plot.gif")
  file.remove(list.files(pattern=".png"))
  rm(x_unique, nof_steps)
  detach(df_plot)
}

plot.bar.2(d, d$year, d$val, d$year)
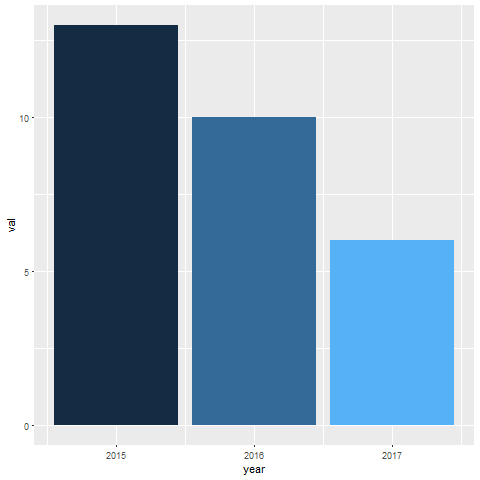
A bit more “interactive” or animated graph is created.
In comparison to static graph:
In addition to R code, the ImageMagic program needs to be installed on your machine, as well. Also the speed, quality and many other parameters can be set, when creating animated gif.
Animated gif can be also included into your SSRS report, your Sharepoint site or any other site – like my blog 🙂 and it will stay interactive. In Power BI, importing animated gif as a picture, unfortunately will not work.
As always, code is available at GitHub.
Happy R-coding!


[…] leave a comment for the author, please follow the link and comment on their blog: R – TomazTsql.R-bloggers.com offers daily e-mail updates about R news and tutorials on topics such as: Data […]
LikeLike
[…] article was first published on R – TomazTsql, and kindly contributed to […]
LikeLike
Your comment is awaiting moderation.
One of our analysts is storing image (png) plots into a SQL server database that have been generated by R scripts using the following after serialization:
##### save all the plots in database
image_file = tempfile()
png(filename = image_file)
plot(training_plot[[1]])
dev.off();
Plot_Output1 <- data.frame(data = readBin(file(image_file, "rb"), what = raw(), n = 1e6))
Plot_Output1_Serialized <- as.raw(serialize(Plot_Output1, connection = NULL))
How do we De-Serialize this image in C# and display in web application which was serialized using R server and stored in SQL Server with data type Varbinary(Max)
LikeLike
Hi,
get the SQL Server string connection defined and use BinaryReader and FileStream to get to the photo:
public static byte[] ReadPhoto(string SQLPath)
{
FileStream stream = new FileStream(SQLPath, FileMode.Open, FileAccess.Read);
BinaryReader reader = new BinaryReader(stream);
byte[] SQLPhoto = reader.ReadBytes((int)stream.Length);
reader.Close();
stream.Close();
return SQLPhoto;
}
If it’s easier, you can also save jpg/gif generated with R code to SQLserver Filetable.
LikeLike
Thanks Tom for quick and detailed response.
I want to save the image in the database varbinary field. Plot_Output1 is defined as output parameter in the stored procedure with varbinary type. We are generating multiple images in R script and saving them in output parameter which will be inserted in table. I do not want to serialize in R because C# code similar to one you mentioned will not be able de-serialize. I just want to save binary image in output parameter in stored proc which can be inserted in database table.
Thanks for your help and support.
LikeLike
[…] article was first published on R – TomazTsql, and kindly contributed to […]
LikeLike
[…] Animated barplot and google map with R It might happen that you will need a animated graph of any kind. For purposes of plotting demographic data and changes through the years, Google Maps and plotting maps, merging and converting jpg files into a animated gif, sure will give a nice visualization effect. Here is a sample of changes over the time period of three years on some dataset of my home town and graph can tell little bit more as numbers ?? […]
LikeLike
[…] Tomaz Kastrun shows how to create animated charts in R using ggplot2: […]
LikeLike