Running *.XDF files using RevoScaleR computational functions versus have dataset available in Columnstore table or in In-Memory OLTP table will be focus of comparison for this blog post.
For this test, I will use the AirLines dataset, available here. Deliberately, I have picked a sample 200 MB (of 13GB dataset) in order to properly test the differences and what should be the best way.
After unzipping the file, I will use following T-SQL query to import the file into SQL Server.
With this example, you can import xdf file directly to SQL Server table (note, that I have transformed a CSV file into XDF and import xdf file into SQL table):
-- must have a write permissions on folder: C:/Program Files/Microsoft SQL Server/130/R_SERVER/library/RevoScaleR/SampleData
DECLARE @RScript nvarchar(max)
SET @RScript = N'library(RevoScaleR)
                rxOptions(sampleDataDir = "C:/Program Files/Microsoft SQL Server/130/R_SERVER/library/RevoScaleR/SampleData")
                inFile <- file.path(rxGetOption("sampleDataDir"), "airsample.csv")
                of <-  rxDataStep(inData = inFile, outFile = "C:/Program Files/Microsoft SQL Server/130/R_SERVER/library/RevoScaleR/SampleData/airline20170428_2.xdf",
                             transformVars = c("ArrDelay", "CRSDepTime","DayOfWeek")
                            ,transforms = list(ArrDelay = as.integer(ArrDelay), CRSDepTime = as.numeric(CRSDepTime), DayOfWeek = as.character(DayOfWeek))
                            ,overwrite = TRUE
                            ,maxRowsByCols = 10000000
                            ,rowsPerRead = 200000)
                OutputDataSet <- rxXdfToDataFrame(of)'

DECLARE @SQLScript nvarchar(max)
SET @SQLScript = N'SELECT 1 AS N'

EXECUTE sp_execute_external_script
     @language = N'R'
    ,@script = @RScript
    ,@input_data_1 = @SQLScript
WITH RESULT SETS ((ArrDelay INT
                    ,CRSDepTime DECIMAL(6,4)
                    ,DofWeek NVARCHAR(20)))
GO
So the whole process is to be done by creating a table, converting the above sp_execute_external_script into procedure and import results from external procedure to the table.
--Complete process
CREATE TABLE AirFlights_small
(id INT IDENTITY(1,1)
,ArrDelay INT
,CRSDepTime DECIMAL(6,4)
,DofWeek NVARCHAR(20)
);
GO

CREATE Procedure ImportXDFtoSQLTable
AS
DECLARE @RScript nvarchar(max)
SET @RScript = N'library(RevoScaleR)
                rxOptions(sampleDataDir = "C:/Program Files/Microsoft SQL Server/130/R_SERVER/library/RevoScaleR/SampleData")
                inFile <- file.path(rxGetOption("sampleDataDir"), "airsample.csv")
                of <-  rxDataStep(inData = inFile, outFile = "airline20170428_2.xdf",
                transformVars = c("ArrDelay", "CRSDepTime","DayOfWeek")
            ,transforms = list(ArrDelay = as.integer(ArrDelay), CRSDepTime = as.numeric(CRSDepTime), DayOfWeek = as.character(DayOfWeek))
            ,overwrite = TRUE
            ,maxRowsByCols = 10000000)
             OutputDataSet <- data.frame(rxReadXdf(file=of, varsToKeep=c("ArrDelay", "CRSDepTime","DayOfWeek")))'
DECLARE @SQLScript nvarchar(max)
SET @SQLScript = N'SELECT 1 AS N'
EXECUTE sp_execute_external_script
     @language = N'R'
    ,@script = @RScript
    ,@input_data_1 = @SQLScript
WITH RESULT SETS ((ArrDelay INT,CRSDepTime DECIMAL(6,4),DofWeek NVARCHAR(20)));
GO

INSERT INTO AirFlights_small
EXECUTE ImportXDFtoSQLTable;
GO
There you go. Data are in T-SQL Table. Now we can start with comparisons. I will be measuring the time to get average air delay time per day of the week.

RevoScaleR
With using the RevoScaleR package, I will be using rxCrossTabs function with the help of transform argument to convert day of the week into factors:
#importing data
outFile2 <- rxDataStep(inData = inFile, outFile = "C:/Program Files/Microsoft SQL Server/130/R_SERVER/library/RevoScaleR/SampleData/airline20170428_2.xdf",
            transformVars = c("ArrDelay", "CRSDepTime","DayOfWeek")
           ,transforms = list(ArrDelay = as.integer(ArrDelay), CRSDepTime = as.numeric(CRSDepTime), DayOfWeek = as.character(DayOfWeek))
           ,overwrite = TRUE
           ,maxRowsByCols = 10000000)

of2 <- data.frame(rxReadXdf(file=outFile2, varsToKeep=c("ArrDelay", "CRSDepTime","DayOfWeek")))

summary(rxCrossTabs(ArrDelay~DayOfWeek
                    ,data = of2  #outFile2
                    ,transforms = transforms
                    ,blocksPerRead=300000), output="means")
Now get those times:
# Getting times
system.time({
  summary(rxCrossTabs(ArrDelay~DayOfWeek
                      ,data = of2
                      ,transforms = transforms
                      ,blocksPerRead=300000), output="means")
  })
With results of 7.8 on elapsed time and computation time of 3.8 second.
Rows Read: 8400013, Total Rows Processed: 8400013, Total Chunk Time: 3.825 seconds
Computation time: 3.839 seconds.
   user  system elapsed
   2.89    0.37    7.89
T-SQL query without any specifics
To have a baseline, let’s run the following query:
SET STATISTICS TIME ON;
SELECT
[DofWeek]
,AVG(ArrDelay) AS [means]
FROM
    AirFlights_small
GROUP BY
    [DofWeek]
SET STATISTICS TIME OFF;
And check these time statistics
SQL Server Execution Times:
CPU time = 6124 ms, elapsed time = 2019 ms.
Warning: Null value is eliminated by an aggregate or other SET operation.
Obiously the CPU / computation time is higher, although the elapsed time is faster.
ColumnStore Table
Let’s create a nonclustered column store index.
CREATE TABLE AirFlights_CS
(id INT IDENTITY(1,1)
,ArrDelay INT
,CRSDepTime DECIMAL(6,4)
,DofWeek NVARCHAR(20)
);
GO
INSERT INTO AirFlights_CS(ArrDelay, CRSDepTime, DofWeek)
SELECT ArrDelay, CRSDepTime, DofWeek FROM AirFlights_small

CREATE NONCLUSTERED COLUMNSTORE INDEX NCCI_AirFlight
ON AirFlights_CS
(id, ArrDelay, CRSDepTime, DofWeek);
GO
With the execution of the same query
SET STATISTICS TIME ON;
SELECT
[DofWeek]
,AVG(ArrDelay) AS [means]
FROM
  AirFlights_CS
GROUP BY     [DofWeek] SET STATISTICS TIME OFF;
The following time statistics are in
SQL Server Execution Times:
CPU time = 202 ms, elapsed time = 109 ms.
Warning: Null value is eliminated by an aggregate or other SET operation.
In-Memory OLTP
To get Memory optimized table, we need to add a filegroup and create a table with memory optimized turned on:
CREATE TABLE dbo.AirFlight_M
(
  id INT NOT NULL PRIMARY KEY NONCLUSTERED
 ,ArrDelay INT
 ,CRSDepTime DECIMAL(6,4)
 ,DofWeek NVARCHAR(20)
) WITH (MEMORY_OPTIMIZED=ON, DURABILITY = SCHEMA_AND_DATA);
GO
And insert the data
INSERT INTO AirFlight_M
SELECT * FROM AirFlights_small
Running the simple query
SET STATISTICS TIME ON;
SELECT
[DofWeek]
,AVG(ArrDelay) AS [means]
FROM
    AirFlight_M
GROUP BY
    [DofWeek]
SET STATISTICS TIME OFF;
results are:
SQL Server Execution Times:
CPU time = 6186 ms, elapsed time = 1627 ms.
Warning: Null value is eliminated by an aggregate or other SET operation.
These results were somehow expected, mostly because the ColumnStore table is the only one having index and reading (also by looking in execution plans) optimized with comparison to others. Also degree of parallelism, clustered and non-clustered index can be pushed, but the idea was to have tests similar to the one in RevoScaleR and R environemnt. With R, we can not push any index on the XDF file.
In R we run:
system.time({
LMResults <- rxLinMod(ArrDelay ~ DayOfWeek, data = outFile2, transforms = transforms)
LMResults$coefficients
})
And in SSMS we run:
SET STATISTICS TIME ON;
-- 1. T-SQL
DECLARE @RScript nvarchar(max)
SET @RScript = N'library(RevoScaleR)
                LMResults <- rxLinMod(ArrDelay ~ DofWeek, data = InputDataSet)
                OutputDataSet <- data.frame(LMResults$coefficients)'
DECLARE @SQLScript nvarchar(max)
SET @SQLScript = N'SELECT ArrDelay, DofWeek FROM [dbo].[AirFlights_small]'
EXECUTE sp_execute_external_script
     @language = N'R'
    ,@script = @RScript
    ,@input_data_1 = @SQLScript
WITH RESULT SETS ((
            --DofWeek NVARCHAR(20)
        --    ,
            Coefficient DECIMAL(10,5)
            ));
GO
SET STATISTICS TIME OFF;


SET STATISTICS TIME ON;
-- 2. ColumnStore
DECLARE @RScript nvarchar(max)
SET @RScript = N'library(RevoScaleR)
                LMResults <- rxLinMod(ArrDelay ~ DofWeek, data = InputDataSet)
                OutputDataSet <- data.frame(LMResults$coefficients)'
DECLARE @SQLScript nvarchar(max)
SET @SQLScript = N'SELECT ArrDelay, DofWeek FROM [dbo].[AirFlights_CS]'
EXECUTE sp_execute_external_script
     @language = N'R'
    ,@script = @RScript
    ,@input_data_1 = @SQLScript
WITH RESULT SETS ((
            --DofWeek NVARCHAR(20)
        --    ,
            Coefficient DECIMAL(10,5)
            ));
GO
SET STATISTICS TIME OFF;


SET STATISTICS TIME ON;
-- 3. Memory optimized
DECLARE @RScript nvarchar(max)
SET @RScript = N'library(RevoScaleR)
                LMResults <- rxLinMod(ArrDelay ~ DofWeek, data = InputDataSet)
                OutputDataSet <- data.frame(LMResults$coefficients)'
DECLARE @SQLScript nvarchar(max)
SET @SQLScript = N'SELECT ArrDelay, DofWeek FROM [dbo].[AirFlight_M]'
EXECUTE sp_execute_external_script
     @language = N'R'
    ,@script = @RScript
    ,@input_data_1 = @SQLScript
WITH RESULT SETS ((
            --DofWeek NVARCHAR(20)
        --    ,
            Coefficient DECIMAL(10,5)
            ));
GO
SET STATISTICS TIME OFF;
Conclusion
Gathering statistics on CPU time and elapsed time when running simple Linear regression, this is comparison:
df_LR_comparison <- data.frame (
  method = c("T-SQL", "ColumnStore", "Memory Optimized", "RevoScaleR")
  ,CPUtime = c(3000,1625,2156,7689)
  ,ElapsedTime = c(14323,10851,10600,7760)
  )
library(ggplot2)

ggplot(df_LR_comparison, aes(method, fill=method)) +
  geom_bar(aes(y=ElapsedTime), stat="identity") +
  geom_line(aes(y=CPUtime, group=1), color="white", size=3) +
  scale_colour_manual(" ", values=c("d1" = "blue", "d2" = "red"))+
  #scale_fill_manual("",values="red")+
  theme(legend.position="none")
Showing that elapsed time for R environment with RevoScaleR is fastest (and getting data from XDF), where as simple T-SQL run with sp_execute_external_script and using RevoScaleR gives the slowest response.
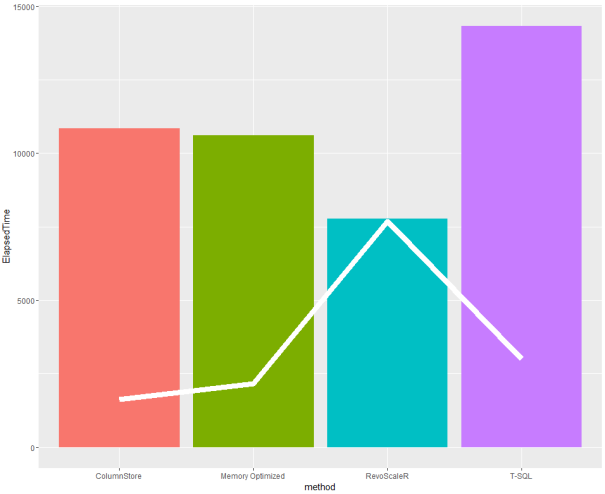
In terms of CPU time (white line), Columnstore with RevoScaleR call through external procedure outperforms all others.
Final conclusion: When running statistical analysis (using RevoScaleR or any other R library), use columnstore and index optimized tables/views to receive best CPU and elapsed times. Important to remember is also the fact, that any aggregations and calculations that can be done within SQL Server, are better to be perfomered there.
As always, code is available at GitHub.
Happy coding! 🙂


Tomaz,
I’m really excited to see you investigating this because I’ve spent a fair amount of time recently trying to understand performance characteristics similar to this! I’ve got a number of findings, some similar some different, that I’ll pass along in a comment or more likely an email in the next couple of days.
But I do have some question to start. Can you explain exactly how you’re getting at the white line on the bottom chart? Is that the CPU time of SQL Server (sqlservr.exe)?
When passing data to R via @input_data_1 you’ll see there’s CPU usage in sqlservr.exe that *I’m guessing* is basically converting the SQL data representation into a Bxl data format. Once that’s transferred to BxlServer.exe (rxLinMod) the CPU usage from R/BxlServer isn’t going to get reported by SET STATISTICS TIME ON. You also won’t be able to get the accurate CPU time counts from calling system.time / proc.time in R because that will be limited to the R process, not BxlServer.exe. It’s possible to get accurate CPU times from the BxlServer.exe process via calls to Windows APIs exposed in Process Explorer (https://technet.microsoft.com/en-us/sysinternals/processexplorer.aspx) / .NET Process objects (e.g. https://msdn.microsoft.com/en-us/library/system.diagnostics.process.totalprocessortime(v=vs.110).aspx).
Bob
LikeLike
[…] article was first published on R – TomazTsql, and kindly contributed to […]
LikeLike
Hi Bob,
The white line represents the CPU time and the bars represented elapsed time. CPU time is mostly the execution of Rterm.exe command (this can also be seen in Mark’s Process Explorer) and BxlServer.exe. Also examining the execution plan, once the data is out of SQL Server, SQL Server can not collect the internal statistics (CPU, RAM, etc.). I have used the SET STATISTISTICS TIME just for the simplicity of comparison.
But the amout of CPU is different when using and calling T-SQL data from a table with index “optimized” / columnstore index. But to get the best statistics, I have not found a way yet.
For further exploring, I can recommend:
1) in rlauncher.config change the TRACE_LEVEL and check the rlauncher.log for the execution of the query
2) the extensibilityLog for eash of the session that SQLSatellite is creating
3) use windows debugger (windbg) for further in detailed analysis.
Best, Tomaž
From my experience, by far, the best information I got was from windbg.
LikeLike
[…] article was first published on R – TomazTsql, and kindly contributed to […]
LikeLike
Using monetDB or Aerospike should be much faster.
LikeLike
aspx) / . […] article was first published on R – TomazTsql, and kindly contributed to […]
LikeLike
aspx) / . aspx) / .
LikeLike
[…] article was first published on R – TomazTsql, and kindly contributed to […] aspx) / .
LikeLike
aspx) / . […] article was first published on R – TomazTsql, and kindly contributed to […]
LikeLike
[…] article was first published on R – TomazTsql, and kindly contributed to […] aspx) / . aspx) / .
LikeLike