R has been around long time and the packages have evolved through the years as well. From the initial releases, updates, to new packages. Like many open-source and community driven languages, R is not an exception. And getting the first release dates of R packages requires little bit of web scrapping and lots of fun.
CRAN – Comprehensive R Archive Network – has invested a lot of people, rules and hours of work to have the packages available for general public in tidy, ready-to-use and easy-to-use fashion.
Last R Package updates
First, let’s check the last package update dates. By loading rvest and getting the data from CRAN web site: https://cran.r-project.org/web/packages/available_packages_by_date.html we are able to turn the HTML table into usable data.frame in R.
library(rvest)
library(ggplot2)
url = 'https://cran.r-project.org/web/packages/available_packages_by_date.html'
CRANpage <- read_html(url)
tbls <- html_nodes(CRANpage, "table") # since HTML is in table; no need to scrape td/tr elements
table1 <- html_table(tbls[1], fill = TRUE)
dd <- data.frame(table1[1])
#house cleaning
dd$Date <- as.Date(dd$Date)
### simple graph
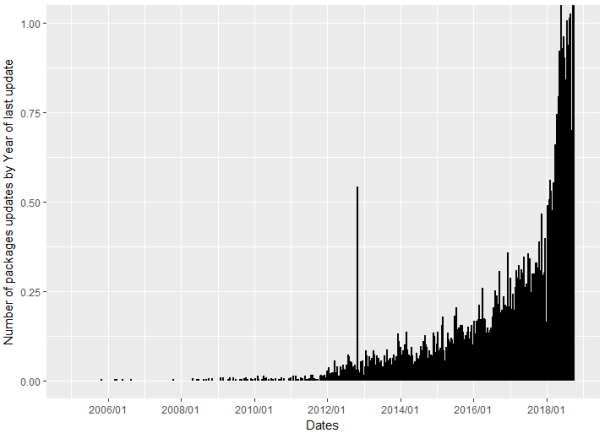
ggplot(dd, aes(x=Date)) +
geom_dotplot(binwidth =12) +
labs(x = "Dates", y = "Number of packages updates by Year of last update") +
scale_x_date(date_breaks= "2 years", date_labels = "%Y/%m", limits = as.Date(c("2005-01-01", "2018-10-10")))
Based on this graph, we can see that many of the R packages have been updated in past year or two.
So, how many? So we run the following statement:
library(dplyr)
library(lubridate)

# updates by year
dd_y <- dd %>%
mutate( PYear= year(Date)) %>%
select (PYear) %>%
group_by(PYear) %>%
summarise(
  nof = n()
)
with the results:
# A tibble: 14 x 2
   PYear   nof
   <dbl> <int>
 1  2005     1
 2  2006     4
 3  2007     1
 4  2008    10
 5  2009    25
 6  2010    32
 7  2011    65
 8  2012   464
 9  2013   575
10  2014   764
11  2015  1158
12  2016  1772
13  2017  2683
14  2018  5583
So out of 13137 packages (on October 7th, 2018), 5583 have been updated in year 2018 and additional 2683 in 2017.
By running a simple stats:
dd_y %>%
mutate(cumsum = cumsum(nof)
,percY = nof/cumsum(nof)
,percC = cumsum(nof)/sum(nof))
we can see how active many of the packages have been in terms of updates.
# A tibble: 14 x 5
   PYear   nof cumsum percY     percC
   <dbl> <int>  <int> <dbl>     <dbl>
 1  2005     1      1 1.00  0.0000761
 2  2006     4      5 0.800 0.000381
 3  2007     1      6 0.167 0.000457
 4  2008    10     16 0.625 0.00122
 5  2009    25     41 0.610 0.00312
 6  2010    32     73 0.438 0.00556
 7  2011    65    138 0.471 0.0105
 8  2012   464    602 0.771 0.0458
 9  2013   575   1177 0.489 0.0896
10  2014   764   1941 0.394 0.148
11  2015  1158   3099 0.374 0.236
12  2016  1772   4871 0.364 0.371
13  2017  2683   7554 0.355 0.575
14  2018  5583  13137 0.425 1.00
So majority (or 2/3) of the packages have been actively updated in last 2 years (in order to fit the latest R engine updates). A simple correlation will also support this:
#simple correlation
cor(dd_y)[1,2]
with the value of 0.77.
Funny question: Is there any correlation of the update package and the month?
And the answer is: No 🙂
dd_ym <- dd %>%
mutate( PYear= year(Date)
,month_name = month(Date, label = FALSE)) %>%
select (PYear,month_name) %>%
group_by(PYear,month_name) %>%
summarise(
nof = n()
)
cor(dd_ym)[1,2]
with the correlation coefficient of -0.06. So Month does not play any particular importance. But Since the year 2018 is not over yet, it might be slightly unfair. So, to further check and support this, the distribution of the updates of R packages over months, I have excluded the year 2018 and anything prior to 2010.:
#check distribution over months
dd_ym2010 <- dd_ym %>%
  filter(PYear > 2010 & PYear < 2018)

boxplot(dd_ym2010$nof~dd_ym2010$month_name,
main="R Packages update over months", xlab = "Month",
ylab="Number of Packages")
and we can see the boxplot:
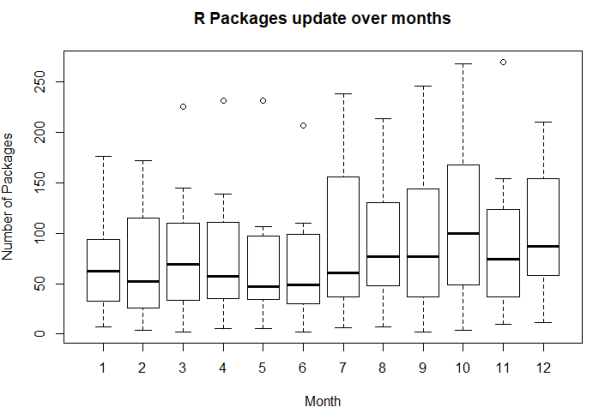
So more updates are coming in autumn times. But the results of correlation:
cor(dd_ym2010)[2,3]
is still just 0.155, making it hard to draw any concrete conclusions. Adding year 2018 will skew the picture and add several outliers, as the fact that year 2018 is still a running year (as of writing this blog post).
Initial dates of R Package Release
To get the complete picture, not just last updates of the packages, but the complete First or initial release dates of all the packages, some further digging was involved. Again, from CRAN archive web pages, the dates of updates and number of updates have been scrapped, in order for these statistics to be prepared.
A loop over all the package archives, has resulted in in final data frame.
###########################
### Get initial Dates #####
###########################

rm(list = Filter(exists, c("packageNames")))
packageNames <- dd$Package

# rm(df_first)
#create a dataframe to keep the data types in order
df_first <- data.frame(name=c("TK_NA")
              ,firstRelease=c(as.Date("1900-12-31"))
              ,nofUpdates=c(0))

for (i in 1:length(packageNames)){
     url1 <- 'https://cran.r-project.org/src/contrib/Archive/'
     name1 <- packageNames[i]
     url2 <- paste0(url1,name1,'/')

ifErrorPass <- tryCatch(read_html(url2), error=function(e) e)
if(inherits(ifErrorPass, "error")) next # if package does not have archive!!!

   cp <- read_html(url2)
   t2 <- html_nodes(cp, "table")
   t2 <- html_table(t2[1], fill = TRUE)
   rm(list = Filter(exists, c("dd2")))
   dd2 <- data.frame(t2[1])
   dat <- dd2$Last.modified
   dat <- as.Date(dat, format = '%Y-%m-%d')
   firstRelease <- dat[order(format(as.Date(dat),"%Y%m%d"))[1]]
   numberOfUpdates <- length(dat)
   df_first <- rbind(df_first,data.frame(name=name1,firstRelease=as.Date(firstRelease, format='%Y-%m-%d'),nofUpdates=numberOfUpdates))
}

# clean my initial row when creating data.frame
myData = df_first[df_first$firstRelease > '1900-12-31',]
After leaving this part running for roughly 10 minutes, the code has successfully scraped all the archives of the CRAN web repository. But not all packages have archive folder yet. And this should mean, that there is not yet any updates for these packages (correct me, If I am wrong. thanks). So some additional data wrangling was needed:
# add missing packages that did not fall into archive folder on CRAN

myDataNonArchive <- dd$Package[!dd$Package %in% myData$name]
myDataNonArchive2 <- cbind(dd[dd$Package %in% myDataNonArchive,c(2,1)],1)

names(myData) <- c("Name","firstRelease","nofUpdates")
names(myDataNonArchive2) <- c("Name","firstRelease","nofUpdates")

finalArchive <- data.frame(rbind(myData, myDataNonArchive2))
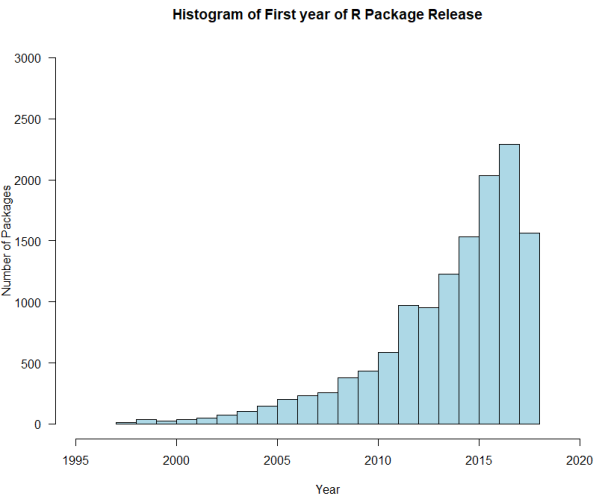
And final graph of the inital release year of packages, can be plotted:
hist(year(finalArchive$firstRelease),
main = paste("Histogram of First year of R Package Release")
,xlab="Year",ylab="Number of Packages"
,col="lightblue", border="Black"
,xlim = c(1995, 2020), las=1, ylim=c(0,3000))
And the graph:
With the following numbers (focusing only on past years):
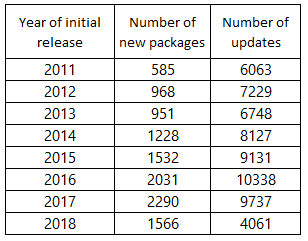
We can conclude that in year 2018, we might not see a positive trend in new package development as in the past years (this is my personal view and conclusion). Another indicator showing this is the number of updates in year 2018 – the year of a major R upgrade – for all the packages released in year 2018 is declining in comparison with previous years. I guess, years 2016 and 2017 were “data science years” and golden years for R.
As always, complete code is available at Github.
Happy R-coding!


[…] Tomaz Kastrun takes a look at CRAN package update dates: […]
LikeLike
Hi!! very interesting code, just to share, this is what I’ve got until 2019 with the part of the code oriented to retrieve new packages fist publication date (I think):
year Frec.Abs.
2006 3
2007 1
2008 8
2009 21
2010 26
2011 57
2012 388
2013 464
2014 618
2015 943
2016 1342
2017 1687
2018 2779
2019 5439
Total: 13776
¿What could I be missing out?
library(rvest)

library(ggplot2)

url = 'https://cran.r-project.org/web/packages/available_packages_by_date.html'

CRANpage <- read_html(url)

tbls <- html_nodes(CRANpage, "table") # since HTML is in table; no need to scrape td/tr elements

table1 <- html_table(tbls[1], fill = TRUE)

dd <- data.frame(table1[1])

#house cleaning

dd$Date <- as.Date(dd$Date)

rm(packageNames)

packageNames <- dd$Package

#str(dd)

rm(packageNames)

packageNames <- dd$Package

# rm(df_first)

df_first <- data.frame(name=c("TK_NA"),firstRelease=c(as.Date("1900-12-31")), nofUpdates=c(0))

for (i in 1:length(packageNames)){

  print(i)

  url1 <- 'https://cran.r-project.org/src/contrib/Archive/'

  #name1 <- 'airportr'

  name1 <- packageNames[i]

  url2 <- paste0(url1,name1,'/')

  ifErrorPass <- tryCatch(read_html(url2), error=function(e) e)

  if(inherits(ifErrorPass, "error")) next # if package does not have archive!!!

  cp <- read_html(url2)

  t2 <- html_nodes(cp, "table")

  t2 <- html_table(t2[1], fill = TRUE)

  rm(list = Filter(exists, c("dd2")))

  dd2 <- data.frame(t2[1])

  dat <- dd2$Last.modified

  dat <- as.Date(dat, format = '%Y-%m-%d')

  firstRelease <- dat[order(format(as.Date(dat),"%Y%m%d"))[1]]

  numberOfUpdates <- length(dat)

  df_first  '1900-12-31',]

# add missing packages that did not fall into archive folder on CRAN

myDataNonArchive <- dd$Package[!dd$Package %in% myData$name]

myDataNonArchive2 <- cbind(dd[dd$Package %in% myDataNonArchive,c(2,1)],1)

names(myData) <- c("Name","firstRelease","nofUpdates")

names(myDataNonArchive2) <- c("Name","firstRelease","nofUpdates")

finalArchive <- data.frame(rbind(myData, myDataNonArchive2))

finalArchive$ReportDate <- as.character(finalArchive$firstRelease)

library(lubridate)

finalArchive$year <- year(finalArchive$firstRelease)
LikeLike
[…] have written couple of blog posts on R packages (here | here ) and this blog post is sort of a preset of all the most needed packages for data science, […]
LikeLike