Time functions in DAX

Time functions in DAX are besides simple calculation functions, the most useful functions; mainly because time slicers are one of the most frequently used slicers in Power BI.

2019-12-08 21_02_26-Window

New functions are coming to DAX (Data Analysis Expression Language) regularly, and just recently, the function QUARTER was added.  And this gave me thinking; why not do a standardized DAX, to be added as a “time dimension” to every Power BI, that I create.

Upon opening new Power BI Desktop document, go to Enter Data and add two rows, representing the start and end time:

2

I have inputed two rows:

  • 1978/08/29
  • 2019/12/07

After this, go to Modeling tab and select New Table:

3

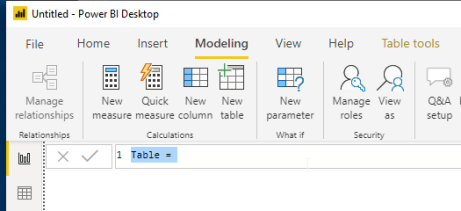
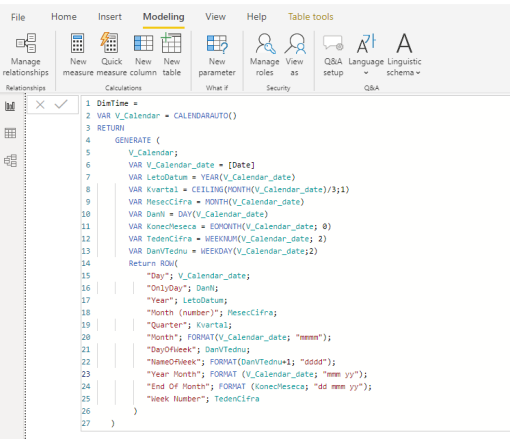
Simply copy/paste the following code:

DimTime =
     VAR V_Calendar = CALENDARAUTO()
RETURN
    GENERATE (
        V_Calendar;
        VAR V_Calendar_date = [Date]
        VAR LetoDatum = YEAR(V_Calendar_date)
        VAR Kvartal = CEILING(MONTH(V_Calendar_date)/3;1)
        VAR MesecCifra = MONTH(V_Calendar_date)
        VAR DanN = DAY(V_Calendar_date)
        VAR KonecMeseca = EOMONTH(V_Calendar_date; 0)
        VAR TedenCifra = WEEKNUM(V_Calendar_date; 2)
        VAR DanVTednu = WEEKDAY(V_Calendar_date;2)
        Return ROW(
            "Day"; V_Calendar_date;
            "OnlyDay"; DanN;
            "Year"; LetoDatum;
            "Month (number)"; MesecCifra;
            "Quarter"; Kvartal;
            "Month"; FORMAT(V_Calendar_date; "mmmm");
            "DayOfWeek"; DanVTednu;
            "NameOfWeek"; FORMAT(DanVTednu+1; "dddd");
            "Year Month"; FORMAT (V_Calendar_date; "mmm yy");
            "End Of Month"; FORMAT (KonecMeseca; "dd mmm yy");
            "Week Number"; TedenCifra
        )
    )

And it should look like this:

4

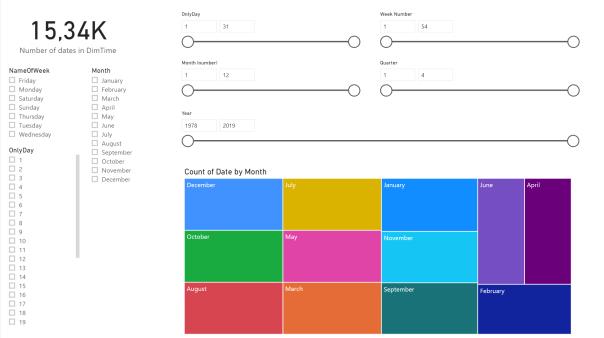
Yielding the corresponding fields in the data structure:

5

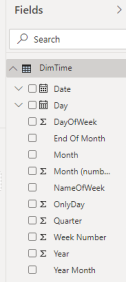
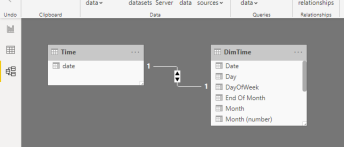
Notice that the DimTime will be automatically populated within the minimum and maximum years; so the range goes from 1978/01/01 until 2019/12/31. You can also add the relation if you want to filter based on the context, but it will have no effect on populating the DimTime table.

6

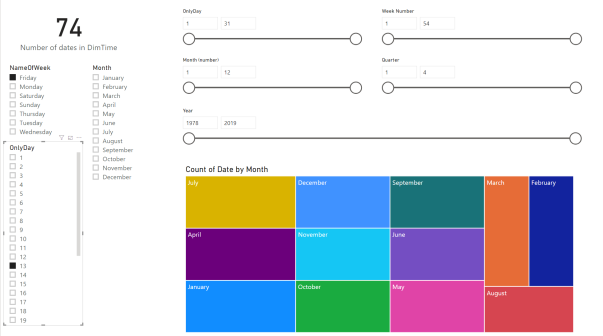
Now I can visualize and count, for example, how many Friday, 13th (since one is just around the corner) are between 1978/01/01 and 2019/31/12. And I can do this simply by adding couple of slicers:

7

And by selecting Friday and 13, I get the result: 74.

8

And If I want to check this; let’s see, how many are in Year 2019:
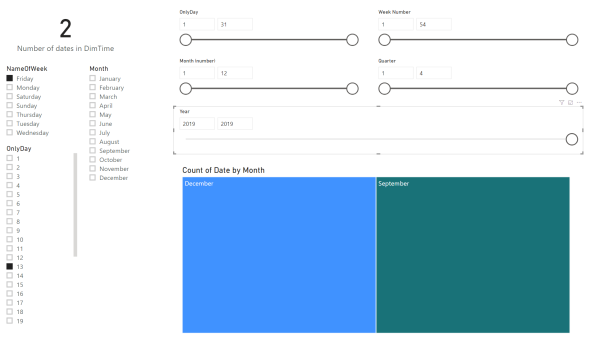
9

Only two! 🙂

Power BI (with DAX) is available at GitHub here.

Happy data slicing 🙂


Tagged with: , , , ,
Posted in Uncategorized
One comment on “Time functions in DAX
  1. […] Tomaz Kastrun reviews the different DAX functions related to time in Power BI: […]

    Like

Leave a comment

Follow TomazTsql on WordPress.com
Programs I Use: SQL Search
Programs I Use: R Studio
Programs I Use: Plan Explorer
Rdeči Noski – Charity

Rdeči noski

100% of donations made here go to charity, no deductions, no fees. For CLOWNDOCTORS - encouraging more joy and happiness to children staying in hospitals (http://www.rednoses.eu/red-noses-organisations/slovenia/)

€2.00

Top SQL Server Bloggers 2018
TomazTsql

Tomaz doing BI and DEV with SQL Server and R, Python, Power BI, Azure and beyond

Discover WordPress

A daily selection of the best content published on WordPress, collected for you by humans who love to read.

Revolutions

Tomaz doing BI and DEV with SQL Server and R, Python, Power BI, Azure and beyond

tenbulls.co.uk

tenbulls.co.uk - attaining enlightenment with the Microsoft Data and Cloud Platforms with a sprinkling of Open Source and supporting technologies!

SQL DBA with A Beard

He's a SQL DBA and he has a beard

Reeves Smith's SQL & BI Blog

A blog about SQL Server and the Microsoft Business Intelligence stack with some random Non-Microsoft tools thrown in for good measure.

SQL Server

for Application Developers

Business Analytics 3.0

Data Driven Business Models

SQL Database Engine Blog

Tomaz doing BI and DEV with SQL Server and R, Python, Power BI, Azure and beyond

Search Msdn

Tomaz doing BI and DEV with SQL Server and R, Python, Power BI, Azure and beyond

R-bloggers

Tomaz doing BI and DEV with SQL Server and R, Python, Power BI, Azure and beyond

R-bloggers

R news and tutorials contributed by hundreds of R bloggers

Data Until I Die!

Data for Life :)

Paul Turley's SQL Server BI Blog

sharing my experiences with the Microsoft data platform, SQL Server BI, Data Modeling, SSAS Design, Power Pivot, Power BI, SSRS Advanced Design, Power BI, Dashboards & Visualization since 2009

Grant Fritchey

Intimidating Databases and Code

Madhivanan's SQL blog

A modern business theme

Alessandro Alpi's Blog

DevOps could be the disease you die with, but don’t die of.

Paul te Braak

Business Intelligence Blog

Sql Insane Asylum (A Blog by Pat Wright)

Information about SQL (PostgreSQL & SQL Server) from the Asylum.

Gareth's Blog

A blog about Life, SQL & Everything ...