In this Microsoft Fabric series:
- Dec 01: What is Microsoft Fabric?
- Dec 02: Getting started with Microsoft Fabric
- Dec 03: What is lakehouse in Fabric?
- Dec 04: Delta lake and delta tables in Microsoft Fabric
- Dec 05: Getting data into lakehouse
- Dec 06: SQL Analytics endpoint
- Dec 07: SQL commands in SQL Analytics endpoint
- Dec 08: Using Lakehouse REST API
- Dec 09: Building custom environments
- Dec 10: Creating Job Spark definition
We have looked into creating the lakehouse, checked the delta lake and delta tables, got some data into the lakehouse, and created a custom environment and Spark job definition. And now we need to see, how to start working with the data.
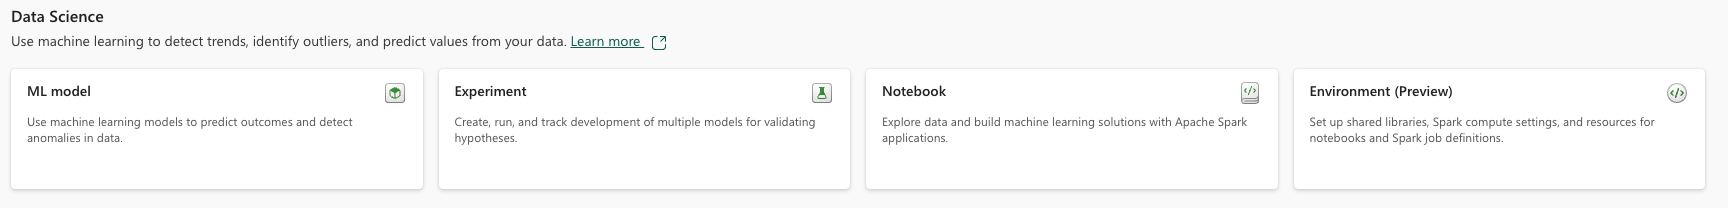
There are four capabilities that one can explore, and since we have covered the Environment, let’s go with the notebook capability.
Once you create a new (or open) notebook, add the lakehouse. I will add the existing one, we created on Day 3 – called Advent2023. You can also choose the preferred language of the notebook – PySpark (Python), Spark (Scala), Spark SQL and SparkR (R). On top of the language, you can also choose the environment; the default workspace or any custom-prepared environment (with custom libraries and compute).
Get the data into notebook, by reading the delta table.
# PySpark - show data
df = spark.read.load('Tables/iris_data',
    format='delta',
    header=True
)
display(df.limit(10))
You can also get the data using SQL that is wrapped in PySpark command.
df = spark.sql(
    """
    SELECT
         CAST(`Sepal.Length` AS DECIMAL(5,1)) AS SepalLength
        ,CAST(`Sepal.Width` AS  DECIMAL(5,1))  AS SepalWidth
        ,CAST(`Petal.Length` AS  DECIMAL(5,1)) AS PetalLength
        ,CAST(`Petal.Width` AS  DECIMAL(5,1)) AS PetalWidth
       ,Species
    FROM
    Advent2023.iris_data LIMIT 3000
    """
    )

df.show()
You can always visualize the data:
import pandas as pd
import warnings
warnings.filterwarnings("ignore")
import seaborn as sns
import matplotlib.pyplot as plt

df2 = df.toPandas()

df2.plot(kind="scatter", x="SepalLength", y="SepalWidth")
plt.show()

sns.jointplot(x="SepalLength", y="SepalWidth", data=df2, size=5)
plt.show()
And the the visual perspective with great Seaborn joinplot:

And now do some features engineering. Create a Vector Assembler:
vectorAssembler = VectorAssembler(inputCols = ['SepalLength','SepalWidth','PetalLength','PetalWidth'], outputCol = 'features')
v_iris_df = vectorAssembler.transform(df)
v_iris_df.show(5)

And convert the new feature to string:
indexer = StringIndexer(inputCol = 'Species', outputCol = 'label')
i_v_iris_df = indexer.fit(v_iris_df).transform(v_iris_df)
i_v_iris_df.show(5)
Now, do the split:
splits = i_v_iris_df.randomSplit([0.6,0.4],1)
train_df = splits[0]
test_df = splits[1]
train_df.count(), test_df.count(), i_v_iris_df.count()
Load the Perceptron classifier and the evaluator function for evaluating the model.
from pyspark.ml.classification import MultilayerPerceptronClassifier
from pyspark.ml.evaluation import MulticlassClassificationEvaluator
Now, let’s play with the neural network and create the layer definition. We are using two hidden layers of 5 nodes each and hence our layers array is [4,5,5,3] (input-4, 2 x hidden-5, output nodes-3). And do the fitting-
layers = [4,5,5,3]
mlp = MultilayerPerceptronClassifier(layers = layers, seed = 1)
#fit
mlp_model = mlp.fit(train_df)
Once the training is completed, use the transform method on the test data frame using the model object from the previous step. We store the results in a data frame called pred_df review some of the columns and check the probabilities
pred_df = mlp_model.transform(test_df)
pred_df.select('features','label','rawPrediction','probability','prediction').show(10)
And finally, evaluate the model:
evaluator = MulticlassClassificationEvaluator(labelCol = 'label', predictionCol = 'prediction', metricName = 'accuracy')
mlpacc = evaluator.evaluate(pred_df)
mlpacc
And the results are pretty good:

Tomorrow we will look the continue with data science!
Complete set of code, documents, notebooks, and all of the materials will be available at the Github repository: https://github.com/tomaztk/Microsoft-Fabric
Happy Advent of 2023! 🙂


[…] article was first published on R – TomazTsql, and kindly contributed to R-bloggers]. (You can report issue about the content on this page […]
LikeLike
[…] Dec 11: Starting data science with Microsoft Fabric […]
LikeLike
[…] Dec 11: Starting data science with Microsoft Fabric […]
LikeLike
[…] Dec 11: Starting data science with Microsoft Fabric […]
LikeLike
[…] Dec 11: Starting data science with Microsoft Fabric […]
LikeLike
[…] Dec 11: Starting data science with Microsoft Fabric […]
LikeLike
[…] Dec 11: Starting data science with Microsoft Fabric […]
LikeLike
[…] Dec 11: Starting data science with Microsoft Fabric […]
LikeLike
[…] Dec 11: Starting data science with Microsoft Fabric […]
LikeLike
[…] Dec 11: Starting data science with Microsoft Fabric […]
LikeLike
[…] Dec 11: Starting data science with Microsoft Fabric […]
LikeLike
[…] Dec 11: Starting data science with Microsoft Fabric […]
LikeLike
[…] Dec 11: Starting data science with Microsoft Fabric […]
LikeLike
[…] Dec 11: Starting data science with Microsoft Fabric […]
LikeLike
[…] Dec 11: Starting data science with Microsoft Fabric […]
LikeLike